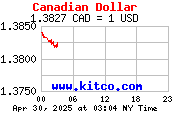
This site compares the looonie to other world currencies. Summary here more detailed analysis here and chart here.
The following graphs show how much of a foreign currency $1 CAN will buy. An upload slope in the graph indicates an increase in value of the loonie against the other currency. This may be good or bad depending on your viewpoint. Clicking a link will bring up the raw data.
| Currency | 30 day | 120 day |
|---|---|---|
| US Dollar | 
|

|
| Euro | 
|

|
| Hong Kong Dollar | 
|

|
| Japanese Yen | 
|

|
| British Pound | 
|

|
| Australian Dollar | 
|

|
| Swiss Franc | 
|

|
 This graph shows the up-to-the-minute value of the US greenback against the loonie. It's the reverse of the top left graph. A downward slope in the graph indicates an increase in value of the loonie against the greenback.
Comments, hate mail etc. to trogl@shaw.ca