CIELAB Color of Pigeons

By - Tim Kvidera

A few years ago I did an extensive study to objectively evaluate the photosensitivity of various pigeon feather colors, how much they faded when exposed to simulated sunlight.  This was published in the Purebred Pigeon, July/August 2010, pp. 12 - 16, "Light Sensitivity of Pigeon Feathers."  In that study I compared the feather color, as determined by a reflective spectrophotometer before and after exposure to ultraviolet light for different amounts of time.  This paper will summarize the findings of where non-faded examples of different pigeon feather colors fall within the CIELAB three dimensional color space.

The X-Rite model SP62 uses spherical geometry to capture the reflected light from the sample as it is illuminated with the range of frequencies of the visual light spectrum.  From the resultant spectral graph software is used to determine the point in three dimensional color space that corresponds to the sample.  CIELAB coordinates assign the sample's position with green/red component (-/+ a*) on the X axis, blue/yellow component (-/+ b*) on the Y axis and dark/light component (0/100 L*) on the Z axis. See Figure 1 below. 


Figure 1: Visual depiction of CIELAB color space.


The method used was to mount the feather samples in white cardboard folders which had a small hole punched in to top ply of the folder that was only slightly larger than the sample port of the spectrophotometer.     This ensured that repeated evaluations of the feather were taken at the same location.    Each of the samples were tested three times and the average of those three tests recorded.     For the most part internal retrices, tail feathers, were used as they are normally covered while the tail is folded shut and not sun faded.     The area of the terminal bar, the dark band of color near the outer end of the tail feather, was used as a consistent spot to test most colors.   
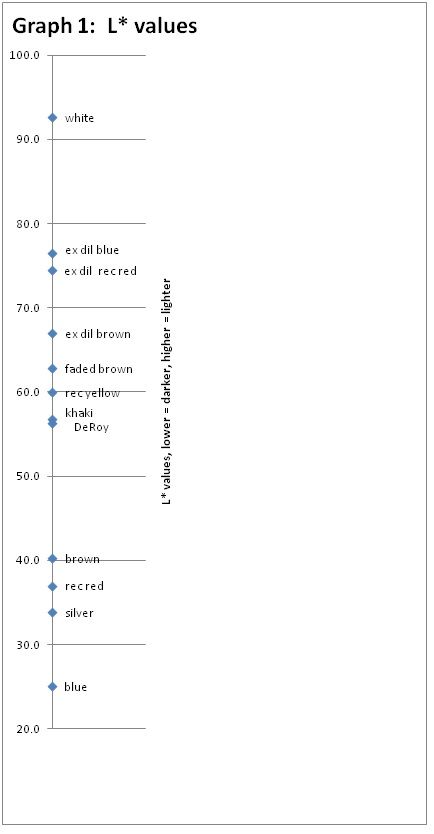
 A limited number of samples of many colors were also tested in the wing shield, flight and wing bar areas to compare to tail feather terminal bar samples of the same color.     As observed subjectively by eye, the spectrophotometer finds the retrice terminal bars to be similarly colored when compared to the wing bars of the same color.    Flights are lighter and yellower than the bars, and wing shields of barred birds are much lighter and yellower than the bar areas. style="font-family: Arial;">

 With the exception of blue and white, all the pigeon colors tested fell in the red/yellow quadrant of CIELAB color space.  Blue is slightly into the green/blue quadrant and white is in the green/yellow.    On the dark to light portion of the CIELAB coordinates, L*, the spectrophotometer puts the colors in expected subjective order.    White and the extreme dilutes are the lightest and blue/black the darkest.    See accompanying table and graphs of the CEILAB coordinates of the colors tested.


Table 1

Summary of CIELAB coordinates pigeon tail feather samples

L* avg

std dev

a* avg

std dev

b* avg

std dev

Brown, N = 14

40.3

2.6

3.0

0.5

5.6

1.2

Khaki, Dilute brown, N = 10

56.8

2.2

4.7

0.6

12.2

1.7

Extreme Dilute Brown, N = 13

67.0

5.9

4.1

0.5

12.0

1.1

Blue, N = 10

25.1

1.7

-0.7

0.2

-1.2

0.3

Silver, N = 9

33.8

3.0

0.8

0.3

2.1

0.7

Extreme Dilute Blue, N = 16

76.5

5.6

2.5

0.6

10.4

1.7

Faded Brown, N = 2

62.8

2.0

4.4

0.3

12.0

0.9

Recessive Red, N = 3

37.0

3.5

7.3

1.0

9.9

0.8

Recessive Yellow, N = 2

60.0

1.9

10.1

0.7

18.2

2.0

Extreme Dilute Recessive Red, N = 3

74.4

0.8

6.9

0.4

17.2

0.1

DeRoy, N = 1

56.3

 - -

9.9

 - -

14.5

 - -

White, N = 6

92.6

0.3

-0.4

0.1

2.6

0.6


The typical way of graphing these points of the CIELAB three dimensional color space is to reduce the L* component to a vertical line plot accompanying the corresponding two dimensional x/y plot of the a* and b* coordinates.    The above data is presented in Graphs 1 and 2 below.
These graphs indicate that there is an appreciable CIELAB determined difference between most of the colors sampled, but that there is very little difference between extreme dilute brown, khaki (dilute brown) and faded brown.   Spectrophotometer data alone may not be able to differentiate these three.    Knowledge of pedigree and visual evaluation of the "smoothness" verses "granular" distribution of the pigment would be of assistance in classifying these three.   
 
Graph 3 plots out the a* and b* coordinates of each of the tested samples of the various colors.  You will note there is variation within each color classification and that each color is in a unique area of the a*/b* chart with the exception of the above mentioned extreme dilute brown, dilute brown and faded brown.  These are pretty much in the same area and have some overlapping.  Another interesting feature of this plotting is that the multiple samples of each color, for the most part, have a similar a*/b* slope, about a 2:1 ratio of yellow to red values.


Graph 3:


Summary:
 
For the most part the various colors of pigeon feathers can be distinctly classified in unique portions of CIELAB color space.  With the exception of blue/black and white all those sampled were found to be in the red/yellow quadrant of color space and usually had twice as much yellow value than red.  Extreme dilute brown, dilute brown and faded brown, which often confuse fanciers as to appropriate classification, were found to be in overlapping areas of CIELAB a*/b* color space.
 
Retrice terminal bars and wing bars are similarly colored on the same bird.  Flights are lighter and yellower than the bars, and wing shields of barred birds are much lighter and yellower than the bar areas.
 
Although ash red birds were not included in the above data, since their tail feathers are typically ashen grey with no darker colored terminal bar, a couple samples of the wing bar area of ash red and dilute ash red were evaluated.  They also fell in the red/yellow quadrant with ash red slightly below a line between brown and recessive red and about a third of the way up from brown towards recessive red ( a*, b* = 5.5, 6.8).  Dilute ash red fell slightly below and left of recessive yellow ( a*, b* = 10.0, 17.5).
 
I would like to thank the many fanciers who contributed feather samples to this study, augmenting what I had in my flock.  Listed in no particular order and hopefully with no omissions....Davis, Huntley, Barnhart, Quick, Pridmore, Sternadel, Hochlan, Hendricks, Mangile, Rupp and Taugner. Thanks guys.


Email the author, Timothy M. Kvidera:


 Back To Start Page

Copyright 2014 by Timothy M. Kvidera
Permission is granted to download or copy for non-commercial individual use only.
The author retains all other rights under copyright.

Ronald R. Huntley
Web Page Designer
Duncan SC, 29334