TRADING INDICATORS AND STRATEGIES
TRADING INDICATORS AND STRATEGIES
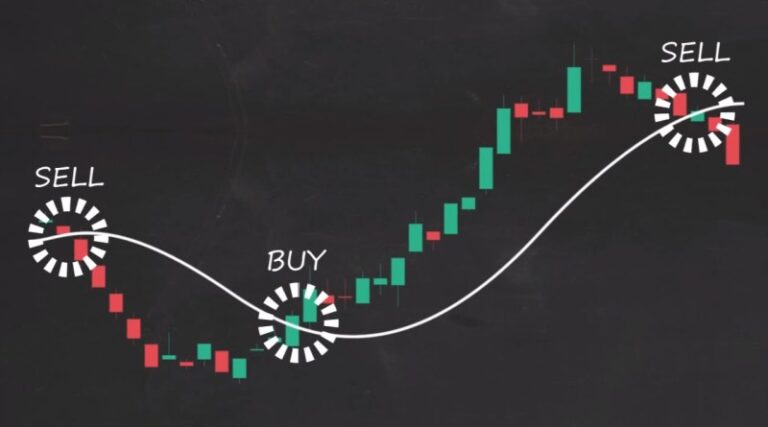
Technical indicators are mathematically-based technical analysis tools that traders and investors use to analyze the past and anticipate future price trends and patterns. The goal when using indicators is to identify trading opportunities. Trading strategies frequently use technical indicators in an objective manner to determine entry, exit, and/or trade management rules.
A large number of technical indicators are available for traders to study, including those in the public domain. In addition, many traders develop their own unique indicators and strategies. This webpage presents few trading strategies which have been developed using most widely used technical indicators, such as Bollinger Bands (BB), Relative Strength Index (RSI), Moving Average Convergence/Divergence (MACD), Wave Trend, Exponential Moving Average etc.
The codes have been developed using Pine Script which is a programming language created by TradingView to backtest trading strategies and create custom indicators and strategies. Step-by-step procedure to use these trading strategies is given below.
STEP-BY-STEP PROCEDURE
(1) Open a free account at https://tradingview.com/
(2) Add desired symbol (Stocks, Futures, Forex, Crypto, Indices) in the Watchlist.
(3) Click on "Pine Editor" in the bottom menu.
(4) Delete all default lines appearing in the Untitled script.
(5) Copy and paste the Pine Script code of the strategy (as given in the description below) in the blank space of Untitled script.
(6) Click on "Save" button to save the script. Again click on "Save" in the box appeared.
(7) Now click on "Add to Chart" button. The indicator strategy will be added to the chart and give BUY and SELL signals for the selected Stock, Future, Forex, Crypto etc.
(8) Please also look into "Overview" section (backtesting results) in the bottom window and examine Net Profit, Percent Profitable, Profit Factor etc.
(9) Test various timeframes (1 minute, 3 minutes, 5 minutes, 15 minutes, 30 minutes, 45 minutes, 1 hour, 2 hours, 3 hours, 4 hours, 1 day, 1 week, 1 month) and find the optimum/best timeframe for the selected symbol to give best profit.
(10) For later use of the strategy (if not already added to the chart) - click on 'Indicators' button in the top menu bar and select the saved strategy listed in "My Scripts".
TRADING STRATEGIES
(1) OPTIMIZED WEIGHTED BUY-SELL STRATEGY
The Optimized Weighted Buy-Sell Strategy is a comprehensive algorithm designed to identify high-confidence trading opportunities by combining seven powerful technical indicators. The strategy ensures that buy and sell trades alternate to avoid multiple consecutive trades in the same direction, providing traders with more reliable signals.
This strategy works across multiple market conditions and timeframes, offering flexibility for trend-following or mean-reversion strategies. It is fully customizable, allowing traders to adjust indicator settings and thresholds to suit their trading style.
Key Features:
- Weighted Multi-Indicator System: Incorporates seven indicators to filter out noise and generate reliable buy/sell signals.
- Prevents Consecutive Entries: Ensures buy and sell trades alternate by tracking position size.
- Highly Customizable: All indicator settings and thresholds can be adjusted by the user.
- Works on All Timeframes: Use it for scalping, swing trading, or long-term trend-following.
- Visual Buy/Sell Cues: Signals are plotted directly on the price chart for easy interpretation.
How It Works:
The strategy calculates weighted scores based on the alignment of multiple indicators. Each indicator is assigned a specific weight, and when the combined score reaches or exceeds the threshold (7 points), a buy or sell signal is generated.
Buy Signal: Generated when bullish conditions align, and the strategy is not already in a long position.
Sell Signal: Triggered when bearish conditions are met, and the strategy already holds a long position.
Indicators and Weightage Breakdown:
| Indicator | Buy Condition | Sell Condition | Weight |
|---|
| Exponential Moving Average (EMA) | Short EMA > Long EMA | Short EMA < Long EMA | 3 points |
| Relative Strength Index (RSI) | RSI < 35, then crosses above 40 | RSI > 65, then crosses below 60 | 2 points |
| MACD | MACD Line > Signal Line | MACD Line < Signal Line | 2 points |
| Stochastic Oscillator | K Line > D Line, K < 30 | K Line < D Line, K > 70 | 1 point |
| Bollinger Bands | Close > Lower Band | Close < Upper Band | 1 point |
| On-Balance Volume (OBV) | OBV increases | OBV decreases | 1 point |
| Average Directional Index (ADX) | ADX > 15, plusDI > minusDI | ADX < 15 or minusDI > plusDI | 2 points |
Customization Options:
This strategy allows users to adjust key parameters to match their trading preferences, including:
- EMA Periods: Control the short and long EMA periods for trend detection.
- RSI and Stochastic Settings: Fine-tune oscillators for different timeframes.
- MACD and ADX Settings: Adjust for stronger or weaker trend conditions.
- Threshold: Modify to increase or reduce sensitivity to signals.
Example Use Case:
Use it for Swing Trading on a 4-hour chart to catch trend reversals or Scalping on a 5-minute chart for rapid movements. Long-term traders can use the daily timeframe with adjusted settings.
Backtesting Results:
Example backtesting results for BTCUSD (CRYPTO) on 1-hour timeframe (3 January 2024 to 18 October 2024):
Total closed trades: 40
Net profit: 28,913 USD
Percent profitable: 47.50%

PINE SCRIPT CODE
// @version=5
strategy("Optimized Weighted Buy-Sell Strategy", overlay=true)
// Inputs for Indicators
emaShort = input.int(9, title="EMA Short Period")
emaLong = input.int(21, title="EMA Long Period")
threshold = input.int(7, title="Threshold for Trade Signal")
rsiPeriod = input.int(14, title="RSI Period")
macdShort = input.int(8, title="MACD Short Period")
macdLong = input.int(21, title="MACD Long Period")
macdSignal = input.int(5, title="MACD Signal Period")
stochK = input.int(14, title="Stochastic K")
stochD = input.int(3, title="Stochastic D")
adxPeriod = input.int(14, title="ADX Period")
adxSmoothing = input.int(14, title="ADX Smoothing")
bbLength = input.int(20, title="Bollinger Bands Length")
bbMultiplier = input.float(2.0, title="Bollinger Bands Multiplier")
// Calculations
emaShortVal = ta.ema(close, emaShort)
emaLongVal = ta.ema(close, emaLong)
rsiVal = ta.rsi(close, rsiPeriod)
[macdLine, signalLine, _] = ta.macd(close, macdShort, macdLong, macdSignal)
stochKVal = ta.stoch(close, high, low, stochK)
stochDVal = ta.sma(stochKVal, stochD)
bbBasis = ta.sma(close, bbLength)
bbStdDev = ta.stdev(close, bbLength)
bbUpper = bbBasis + bbMultiplier * bbStdDev
bbLower = bbBasis - bbMultiplier * bbStdDev
obvVal = ta.cum(close > close[1] ? volume : close < close[1] ? -volume : 0)
[plusDI, minusDI, adxVal] = ta.dmi(adxPeriod, adxSmoothing)
// Define Enhanced Colors for Visibility
brightGreen = color.new(color.lime, 0) // Bright green for Buy
brightRed = color.new(color.red, 0) // Bright red for Sell
textWhite = color.new(color.white, 0) // White text for contrast
// Plotting EMA Indicator Values
plot(emaShortVal, title="EMA Short", color=color.blue, linewidth=2)
plot(emaLongVal, title="EMA Long", color=color.red, linewidth=2)
// Calculate Weighted Buy and Sell Indicators
favorableBuyIndicators =
3 * (emaShortVal > emaLongVal ? 1 : 0) +
2 * (rsiVal < 35 and ta.crossover(rsiVal, 40) ? 1 : 0) +
2 * (ta.crossover(macdLine, signalLine) ? 1 : 0) +
1 * (ta.crossover(stochKVal, stochDVal) and stochKVal < 30 ? 1 : 0) +
1 * (close > bbLower ? 1 : 0) +
1 * (obvVal > obvVal[1] ? 1 : 0) +
2 * (adxVal > 15 and plusDI > minusDI ? 1 : 0)
favorableSellIndicators =
3 * (emaShortVal < emaLongVal ? 1 : 0) +
2 * (rsiVal > 65 and ta.crossunder(rsiVal, 60) ? 1 : 0) +
2 * (ta.crossunder(macdLine, signalLine) ? 1 : 0) +
1 * (ta.crossunder(stochKVal, stochDVal) and stochKVal > 70 ? 1 : 0) +
1 * (close < bbUpper ? 1 : 0) +
1 * (obvVal < obvVal[1] ? 1 : 0) +
2 * (adxVal < 15 or minusDI > plusDI ? 1 : 0)
// Generate Buy and Sell Signals
buySignal = favorableBuyIndicators >= threshold
sellSignal = favorableSellIndicators >= threshold
// Ensure Alternating Trades using position size
if buySignal and strategy.position_size == 0
strategy.entry("Buy", strategy.long)
if sellSignal and strategy.position_size > 0
strategy.close("Buy")
// Enhanced Buy and Sell Plots with Better Visibility
plotshape(series=(buySignal and strategy.position_size == 0), title="Buy Signal", location=location.belowbar,
color=brightGreen, style=shape.labelup, text="BUY", size=size.normal,
textcolor=textWhite, offset=-1)
plotshape(series=(sellSignal and strategy.position_size > 0), title="Sell Signal", location=location.abovebar,
color=brightRed, style=shape.labeldown, text="SELL", size=size.normal,
textcolor=textWhite, offset=1)
(2) WAVE TREND & MOVING AVERAGE BUY-SELL SIGNALS
Wave Trend Oscillator and Exponential Moving Average cross-overs are amongst the most popular and reliable indicators in trading. The Wave Trend Oscillator is an effective indicator in identifying swings. It creates high and low bands between two values. Exponential Moving Averages (EMA) help identify the price trends and potential support and resistance levels. Trading EMA cross-overs is a foundational strategy for trend trading. EMA cross-over occurs when a short-term EMA crosses the long-term EMA, either above (bullish, uptrend) or below (bearish, downtrend).
Using these two indicators, Buy and Sell signals are generated. By default, Wave Trend Oscillator values of -69 and 69 have been used which can be changed by the user. Also, EMA of 12 and 26 have been used which can be changed by the user.
Entry (Buy) conditions are:
Wave Trend - When green line crosses above the red line with value below -69.
Moving Average Crossing - EMA 12 crosses above the EMA 26.
Exit (Sell) conditions are:
Wave Trend - When green line crosses below the red line with value above 69.
Moving Average Crossing - EMA 12 crosses below the EMA 26.
* Buy and Sell signals appear when either of the two conditions (Wave Trend or Moving Average Crossing) are met.
* Example backtesting results for NASDAQ 100 E-mini Futures (NQ1!) on 3 hours timeframe:
Net profit = 12.16%
Profit factor = 1.285

PINE SCRIPT CODE
// This source code is subject to the terms of the Mozilla Public License 2.0 at https://mozilla.org/MPL/2.0/
// © cpkumar21
//@version=5
strategy(shorttitle="MA-WT", title="Wave Trend & Moving Average Buy-Sell Signals by C. P. Kumar", overlay=true)
src = input(close, title="Source")
// === Wave Trend Oscillator ===
n1 = input(12, "Channel Length", group="Wave Trend")
n2 = input(26, "Average Length", group="Wave Trend")
val = input(69, "Cross Value", group="Wave Trend")
obLevel1 = input(60, "Over Bought Level 1", group="Wave Trend")
obLevel2 = input(53, "Over Bought Level 2", group="Wave Trend")
osLevel1 = input(-60, "Over Sold Level 1", group="Wave Trend")
osLevel2 = input(-53, "Over Sold Level 2", group="Wave Trend")
ap = hlc3
esa = ta.ema(ap, n1)
d = ta.ema(math.abs(ap - esa), n1)
ci = (ap - esa) / (0.015 * d)
tci = ta.ema(ci, n2)
wt1 = tci
wt2 = ta.sma(wt1,4)
// === Moving Average ===
ema1 = input(12,title='EMA-1', group="Moving Average")
ema2 = input(26,title='EMA-2', group="Moving Average")
pema1 = ta.ema(src, ema1)
pema2 = ta.ema(src, ema2)
ema1plot = plot(pema1, color=color.new(color.green, 50), style=plot.style_line, linewidth=1, title='EMA-1')
ema2plot = plot(pema2, color=color.new(color.red, 50), style=plot.style_line, linewidth=1, title='EMA 2')
fill(ema1plot, ema2plot, color=pema1>pema2? color.new(color.green, 85):color.new(color.red, 85), editable=true)
usewt = true
usema = true
longwt = usewt and ta.crossover(wt1, wt2) and wt1<-val ? 1 : 0
shortwt = usewt and ta.crossunder(wt1, wt2) and wt1>val ? 1 : 0
longma = usema and ta.crossover(ta.ema(close, 12), ta.ema(close, 26)) ? 1 : 0
shortma = usema and ta.crossunder(ta.ema(close, 12), ta.ema(close, 26)) ? 1 : 0
nullcond = (usewt or usema)
longcount = longwt + longma
shortcount = shortwt + shortma
long = longcount>=1 and nullcond
short = shortcount>=1 and nullcond
if long
strategy.entry("BUY", strategy.long)
if short
strategy.entry("SELL", strategy.short)
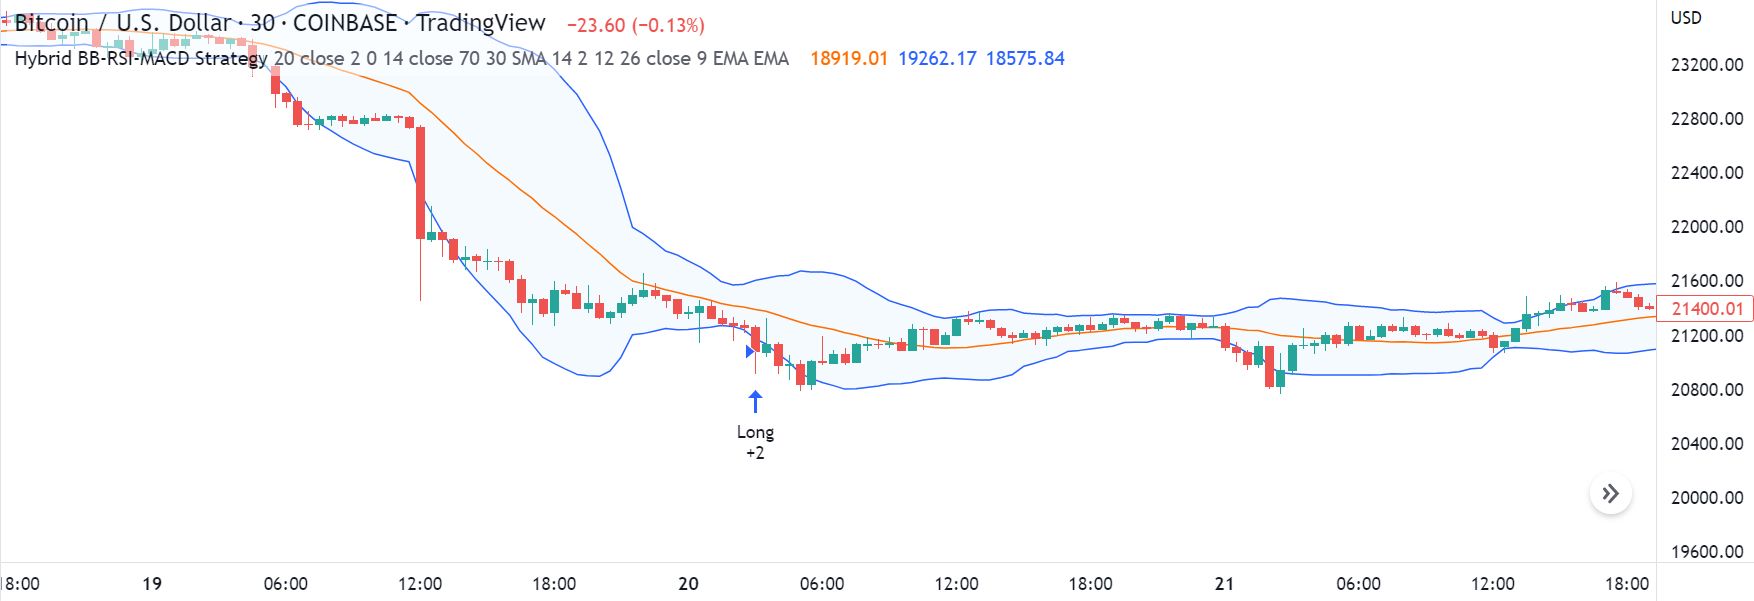
(3) HYBRID BB-RSI-MACD STRATEGY
This is a hybrid strategy combining Bollinger Bands (BB), Relative Strength Index (RSI) and Moving Average Convergence/Divergence (MACD) which are amongst the most popular and effective trading indicators. A Bollinger Band is a momentum indicator used in technical analysis that depicts two standard deviations above and below a simple moving average. The Relative Strength Index (RSI) is a momentum indicator that measures the magnitude of recent price changes to analyze overbought or oversold conditions. The Moving average convergence/divergence (MACD) is a momentum indicator that shows the relationship between two moving averages of a security's price.
Entry (Long) conditions are:
BB - Price below the lower band
MACD - MACD line above the signal line
RSI - RSI value less than 30
Exit (Short) conditions are:
BB - Price above the upper band
MACD - Signal line above the MACD line
RSI - RSI value more than 70
* Not more than one Long or Short signal appear consecutively.
* Long and Short signals appear only when all the above three conditions are met. This may result in lesser number of closed trades but more reliable trades.
* Example backtesting results for BTCUSD (Coinbase) on 30 minutes timeframe (1 January 2022 to 28 September 2022):
Total closed trades = 5
Net profit = 4.23%
Percent profitable = 100%
PINE SCRIPT CODE
// This source code is subject to the terms of the Mozilla Public License 2.0 at https://mozilla.org/MPL/2.0/
// © cpkumar21
//@version=5
strategy("Hybrid BB-RSI-MACD Strategy by C. P. Kumar", process_orders_on_close=true, overlay = true)
start = input.time(timestamp("2022-01-01T00:00:00"), title="Start Date",group="============ BACKTEST RANGE ============")
finish = input.time(timestamp("2025-12-31T00:00:00"), title="Finish Date")
//Configure Date window
dateRange = time >= start and time <= finish ? true : false
usebb = input.bool(defval=true, title="Use Bollinger Bands")
usersi = input.bool(defval=true, title="Use RSI")
usemacd = input.bool(defval=true, title="Use MACD")
//BB
length = input.int(20, minval=1, group = "Bollinger Bands")
srcbb = input(close, title="Source", group = "Bollinger Bands")
mult = input.float(2.0, minval=0.001, maxval=50, title="StdDev", group = "Bollinger Bands")
basis = ta.sma(srcbb, length)
dev = mult * ta.stdev(srcbb, length)
upper = basis + dev
lower = basis - dev
offset = input.int(0, "Offset", minval = -500, maxval = 500, group = "Bollinger Bands")
plot(basis, "Basis", color=#FF6D00, offset = offset)
p1 = plot(upper, "Upper", color=#2962FF, offset = offset)
p2 = plot(lower, "Lower", color=#2962FF, offset = offset)
fill(p1, p2, title = "Background", color=color.rgb(33, 150, 243, 95))
//RSI
ma(source, length, type) =>
switch type
"SMA" => ta.sma(source, length)
"Bollinger Bands" => ta.sma(source, length)
"EMA" => ta.ema(source, length)
"SMMA (RMA)" => ta.rma(source, length)
"WMA" => ta.wma(source, length)
"VWMA" => ta.vwma(source, length)
rsiLengthInput = input.int(14, minval=1, title="RSI Length", group="RSI Settings")
rsiSourceInput = input.source(close, "Source", group="RSI Settings")
rsiob = input.float(70.0, minval=0.001, maxval=100.0, title="Overbought Level", group="RSI Settings")
rsios = input.float(30.0, minval=0.001, maxval=100.0, title="Oversold Level", group="RSI Settings")
maTypeInput = input.string("SMA", title="MA Type", options=["SMA", "Bollinger Bands", "EMA", "SMMA (RMA)", "WMA", "VWMA"], group="MA Settings (RSI)")
maLengthInput = input.int(14, title="MA Length", group="MA Settings (RSI)")
bbMultInput = input.float(2.0, minval=0.001, maxval=50, title="BB StdDev", group="MA Settings (RSI)")
up = ta.rma(math.max(ta.change(rsiSourceInput), 0), rsiLengthInput)
down = ta.rma(-math.min(ta.change(rsiSourceInput), 0), rsiLengthInput)
rsi = down == 0 ? 100 : up == 0 ? 0 : 100 - (100 / (1 + up / down))
rsiMA = ma(rsi, maLengthInput, maTypeInput)
isBB = maTypeInput == "Bollinger Bands"
//MACD
fast_length = input(title="Fast Length", defval=12, group = "MACD")
slow_length = input(title="Slow Length", defval=26, group = "MACD")
src = input(title="Source", defval=close, group = "MACD")
signal_length = input.int(title="Signal Smoothing", minval = 1, maxval = 50, defval = 9, group = "MACD")
sma_source = input.string(title="Oscillator MA Type", defval="EMA", options=["SMA", "EMA"], group = "MACD")
sma_signal = input.string(title="Signal Line MA Type", defval="EMA", options=["SMA", "EMA"], group = "MACD")
// Calculating
fast_ma = sma_source == "SMA" ? ta.sma(src, fast_length) : ta.ema(src, fast_length)
slow_ma = sma_source == "SMA" ? ta.sma(src, slow_length) : ta.ema(src, slow_length)
macd = fast_ma - slow_ma
signal = sma_signal == "SMA" ? ta.sma(macd, signal_length) : ta.ema(macd, signal_length)
hist = macd - signal
longbb = usebb ? close < lower : true
shortbb = usebb ? close > upper : true
longrsi = usersi ? rsi < rsios : true
shortrsi = usersi ? rsi > rsiob : true
longmacd = usemacd ? macd > signal : true
shortmacd = usemacd ? macd < signal : true
nullcond = (usebb or usersi or usemacd)
long = longbb and longrsi and longmacd and dateRange and nullcond
short = shortbb and shortrsi and shortmacd and dateRange and nullcond
if long
strategy.entry("Long", strategy.long)
if short
strategy.entry("Short", strategy.short)
These strategies have been developed by Mr. C. P. Kumar

