
The first thing we have to know is what the general graph of a parabola looks like. Every parabola is a modification of the general parabola.
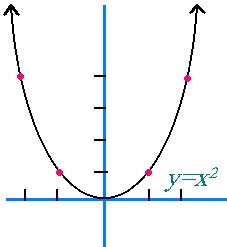
The equation of a general parabola is y = x². This means that the parabola has its vertex at the origin (0,0), and is concave up. The a value in this case is 1.
If we were to sketch the general parabola, we would have to find some points on the parabola. Usually, the x-coordinates of these points are -2,-1,0,1,2. Using these x-coordinates, we must calculate what the corresponding y-values will be. We must substitute the x-coordinates into the original equation (y = x²) in order to determine the y-values. If x = -2, then y = (-2)², or y = 4. Therefore, there is a point at (-2,4).
If we continue calculating the points, we will find out that there are points at (-1,1), (0,0), (1,1), and (2,4). We must plot these points, and then we can sketch our parabola.
Recall that the equation of a parabola in vertex form is y = a(x - h)² + k. It is easiest to sketch a parabola if the equation is written in this form.
The a, h and k values are what change the parabola's shape. Let's look at a few examples to see what happens in each case.
Example 1: Sketch the parabola y = x² + 2.
If we use our five general x-coordinates (-2,-1,0,1,2), we can find out what the matching y-values will be.
If x = -2, then
y = (-2)² + 2
we must use order of operations
y = 4 + 2
y = 6
Point: (-2,6)
If x = -1, then
y = (-1)² + 2
y = 1 + 2
y = 3
Point: (-1,3)
If x = 0, then
y = (0)² + 2
y = 0 + 2
y = 2
Point: (0,2)
If x = 1, then
y = (1)² + 2
y = 1 + 2
y = 3
Point (1,3)
If x = 2, then
y = (2)² + 2
y = 4 + 2
y = 6
Point (2,6)
By looking at all of the points, is there something they all share in common?
If you look at all of the points, the x-coordinate stays the same, but the y-coordinate is changed by 2. The y-value is moved vertically up 2 units.
Therefore, any change in the k value results in a vertical shift of k units. (if k = -3, the parabola will shift vertically 3 units down.)
Example 2: Graph the parabola y = (x - 1)².
Again, we must use the 5 general points to graph the parabola.
If x = -2, then
y = (-2 - 1)²
y = (-3)²
y = 9
Point: (-2,9)
If x = -1, then
y = (-1 - 1)²
y = (-2)²
y = 4
Point: (-1,4)
If x = 0, then
y = (0 - 1)²
y = (-1)²
y = 1
Point: (0,1)
If x = 1, then
y = (1-1)²
y = (0)²
y = 0
Point: (1,0)
If x = 2, then
y = (2 - 1)²
y = (1)²
y = 1
Point: (2,1)
By looking at all of the points, we can see that the parabola has shifted 1 unit horizontally to the right. Whenever the h value is changed, the parabola is shifted h units horizontally in the opposite direction as h.

If x = -2, then
y = -(-2)²
y = -4
Point: (-2,-4)
If x = -1, then
y = -(-1)²
y = -1
Point: (-1,-1)
If x = 0, then
y = -(0)²
y = 0
Point: (0,0)
If x = 1, then
y = -(1)²
y = -1
Point: (1,-1)
If x = 2, then
y = -(2)²
y = -4
Point: (2,-4)
Therefore, if there is a negative in front of the expression, the entire parabola will be reflected about the x-axis. In other words, the parabola's shape stays the same, but has all negative values for y, instead of positive values. The parabola is "flipped upside down".

This time, instead of adding or subtracting anything, we are going to multiply the term by 1/2.
Let's use our general terms again.
If x = -2, then
y = 1/2(-2)²
y = 1/2(4)
y = 2
Point: (-2,2)
If x = -1, then
y = 1/2(-1)²
y = 1/2(1)
y = 1/2
Point: (-1,1/2)
If x = 0, then
y = 1/2(0)²
y = 1/2(0
y = 0
Point: (0,0)
If x = 1, then
y = 1/2(1)²
y = 1/2(1)
y = 1/2
Point: (1,1/2)
If x = 2, then
y = 1/2(2)²
y = 1/2(4)
y = 2
Point: (2,2)
Therefore, there are no reflections, nor are there any vertical or horizontal shifts. Instead, the entire graph is compressed.
* If a > 1, or a < -1, then the graph of y = x² is stretched vertically by a factor of a
* If -1 < a < 1, then the graph of y = x² is compressed vertically by a factor of 1/a.
To Recap:
* If k > 0, then the graph of y = x² is translated vertically up by k units.
* If k < 0, then the graph of y = x² is translated vertically down by k units.
* If h > 0, then the graph of y = x² is translated horizontally left by h units.
* If h < 0, then the graph of y = x² is translated horizontally right by k units.
* If a > 1, or a < -1, then the graph of y = x² is stretched vertically by a factor of a
* If -1 < a < 1, then the graph of y = x² is compressed vertically by a factor of 1/a.
When you use transformations to draw your parabola, it is important that you follow a specific order.
1. Do any vertical stretches or compressions
2. Do any reflections
3. Do any left or right translations
4. Do any up or down translations
Also: If a and k have opposite signs, then the parabola has two x-intercepts. If a and k have the same sign, then the parabola has no x-intercepts.
Practice Questions
Page #364 #3,4,7g,8b,9c.
