
For a verbal description click here.
Not long ago I received an email asking me what the phase relationship was between the primary and secondary voltages in an IF transformer. That set me to thinking, a dangerous thing. I arrived at the following conclusion.In the primary the current lags the voltage by 90 degrees as shown for Vp and Ip in the figure below. The phase of the secondary voltage may be in dispute because of the minus sign that turns up in the magnetic induction formula. But it all depends on which end of the coil is connected where. To avoid unnecessary complexity and possible confusion I am showing the secondary voltage, Vs in phase with the primary current Ip. The secondary current lags the voltage by 90 degrees as in any inductor. As you can see that puts the secondary current, Ip, 180 degrees out of phase with the primary voltage Vp.
For a verbal description click here.
Magnetic induction works in both directions and so, current in the primary induces voltage in the secondary and current in the secondary induces voltage in the primary. The voltage which is re-induced in the primary by the current in the secondary is 180 degrees out of phase with the applied primary voltage. If coupled tuned coils had never been invented and this was a theoretical paper on the subject we would conclude that it will never work and that would be the end of it.We all know they DO work so what's going on. The answer is this explanation is too simplistic. There is more going on than might be supposed by the above waveforms.
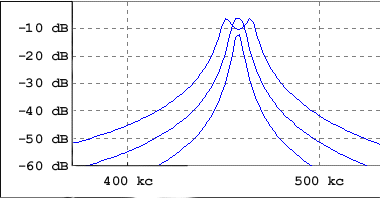
If two coils are coupled too tightly there is a dip in the middle of the response curve as shown in the figure below.
For a verbal description click here.
The top line of the graph is 0 dB, each line is 10 dB and the bottom line is -60 dB. The outer-most curve is for over-coupled coils, the inner-most one is for under-coupled, and the one in the middle is that longed for value which is just right. The highest peaks are at -6 dB. The reason for that will be explained below.I have done some simulations and found the theoretical value of critical coupling to be 1/Q if both windings have the same value of Q. If the windings have different values of Q the equation is,
KCRIT = 1 / SQRT(Q1 Q2), Where KCRIT is the critical value of coupling K, Q1 is the Q of the primary, and Q 2 is the Q of the secondary.
What this means is for a Q of 100 in both tuned circuits the value of critical coupling is 0.01. In simple terms, 1% of the magnetic flux from the primary passes through the secondary winding and 1% of the magnetic flux from the secondary passes through the primary winding.You might expect from that the voltage across the secondary would be 1% of the applied primary voltage. This is not the case because the effect of resonance increases the current circulating in the capacitor/coil loop by a factor of Q. Here is the circuit used in the simulation.

For a verbal description click here.
The values of inductance are from my home made IF transformers. The capacitors were calculated to give resonance at 455 kc. The two resistors lower the Q of the inductors to 100. The coils are not real but theoretical. If it weren't for the resistors the Q would be infinite. The two resistors also introduce an attenuation of Ẅ which is -6 dB. That's why the graph below peaks at -6 dB.The results of the simulation are shown below. With a Q of 100 the value of critical coupling would be 0.01. To obtain the curves shown it was set at 0.03.

For a verbal description click here.
Both graphs have frequency on the horizontal axis. The range is from 435 kc to 475 kc. The upper graph is in dB. The formula is 20 Log ( Vout / Vin ). Vin is measured at the voltage generator on the left not at the top of the primary. Consequently the output cannot be any higher than -6 dB. The lower graph is phase angle relative to the generator. The red line is the phase of the voltage measured at the top of the primary winding. The green line is the phase of the secondary current.The minimum of the output amplitude and the second time the red line crosses zero are very close to 455 kc. The red line crosses zero at exactly the same frequency as the 180 degree crossing point for the green line, secondary current.
Hold a ruler or other straight-edge up to your computer screen. Notice that at the minimum the phase difference between the primary voltage and the secondary current is 180 degrees. As you move over to one of the amplitude humps you will note that the phase difference moves off of 180 degrees.
From this we conclude that, yes in deed, the secondary current does partly cancel the primary voltage when the coils are too tightly coupled. At critical coupling the band narrows down and the dip disappears. The amplitude of the single peak is the same as that of the double ones. At less than critical coupling the band is even narrower but the amplitude is down from the maximum value.
This page last updated Tuesday, September 04, 2018.
Return to the page that sent you here.